About the Query column
The Query column allows you to gain powerful insights into your data. You can create complex relations and apply multiple filters, sorting, and limits—all in one place!
The query column feature can be applied to an entire table, a multiple relation, or even another query column. It works in all tables, including Glide Big Tables.
Configuring the Query column
To create a Query column, add a new column in the data editor and select the Query column type.
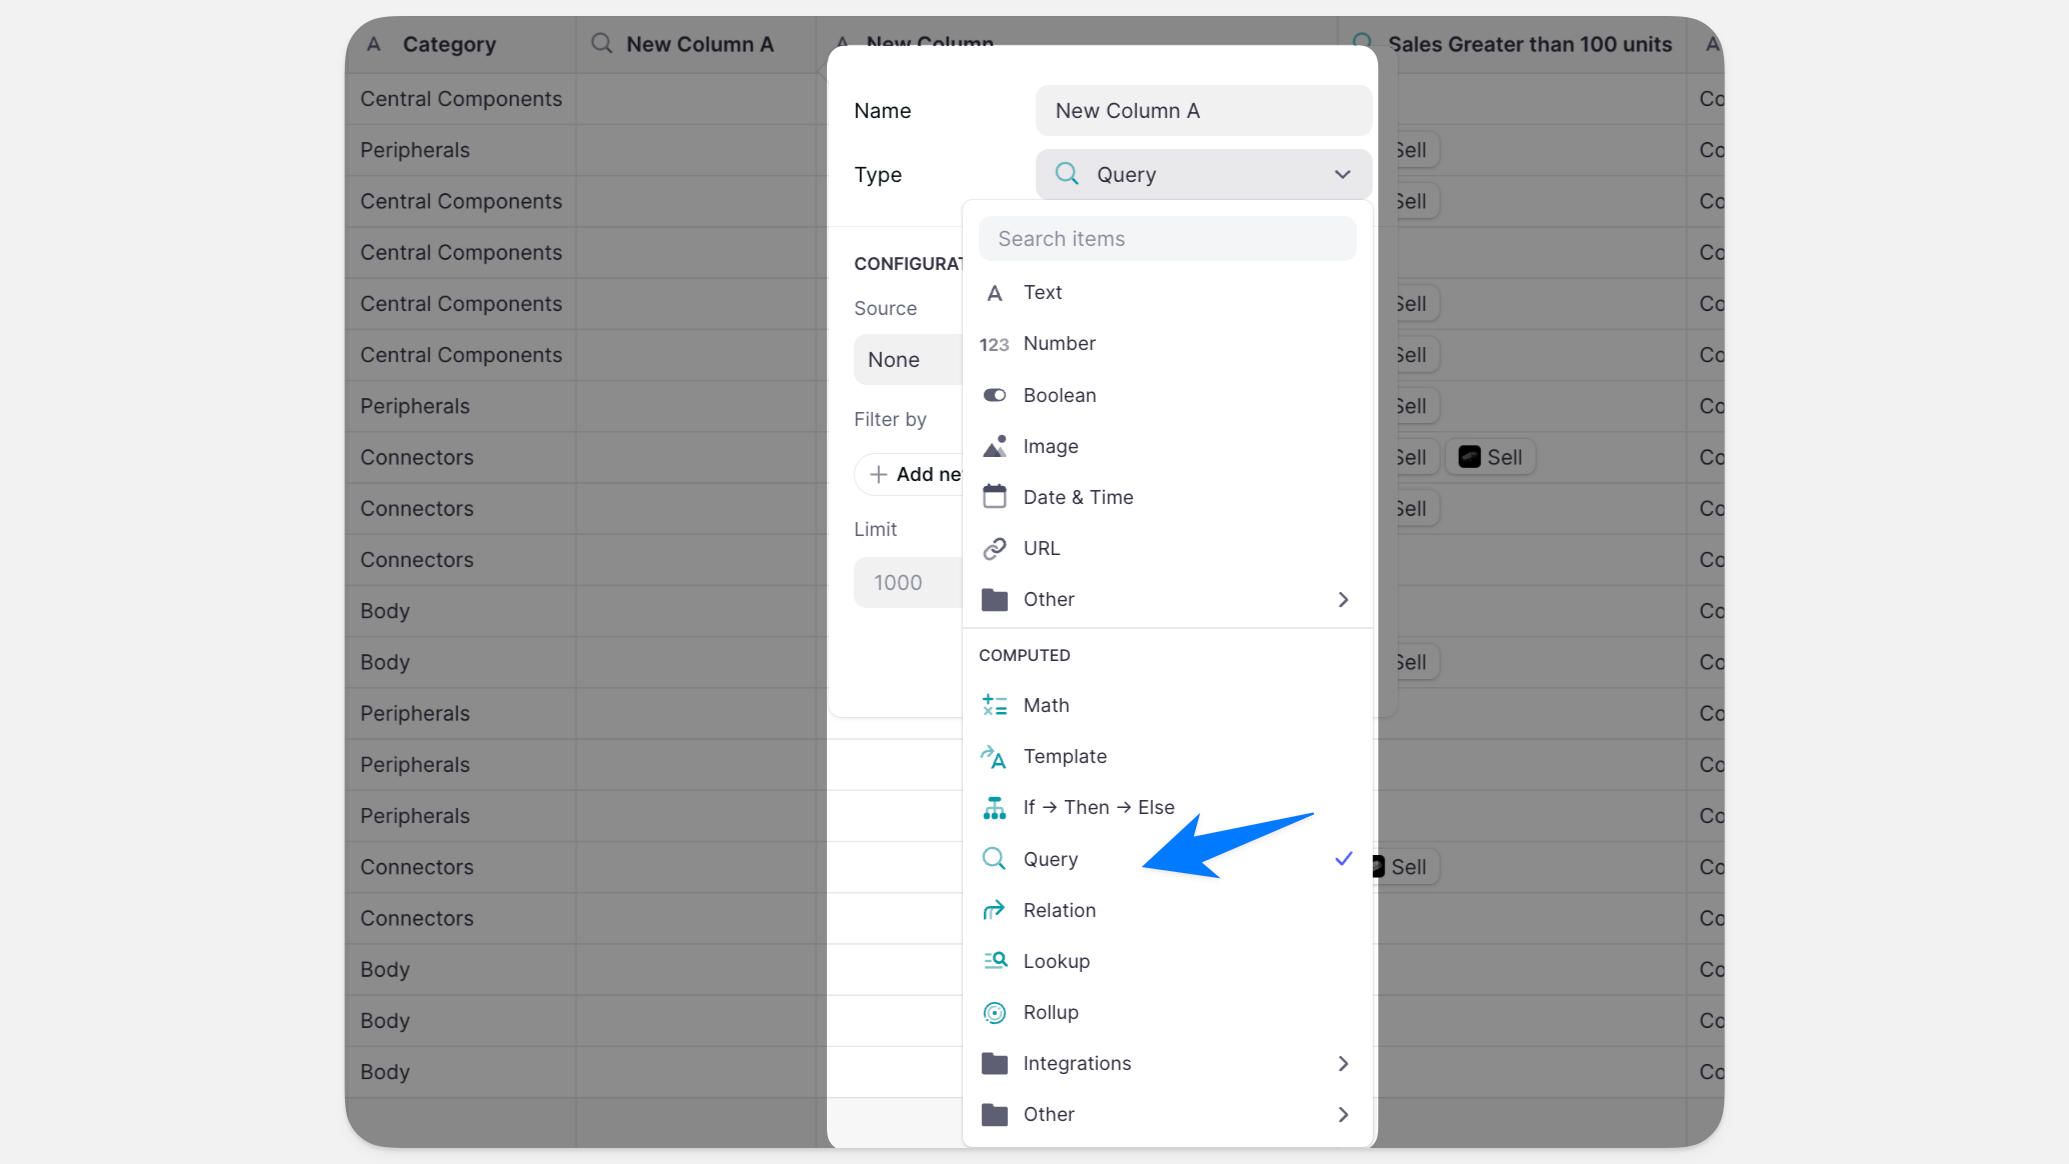
The column has the following configuration options:
Source: This can be any table, a multiple relation in the same table, or even another Query column in the same table.
Filter by: You can add one or more conditions to filter the results of the Query.
Order by: Control the ordering of the results, either ascending or descending by the values of any column in the source.
Limit: Specify how many matching rows will be returned by the Query.
Using “This Row”
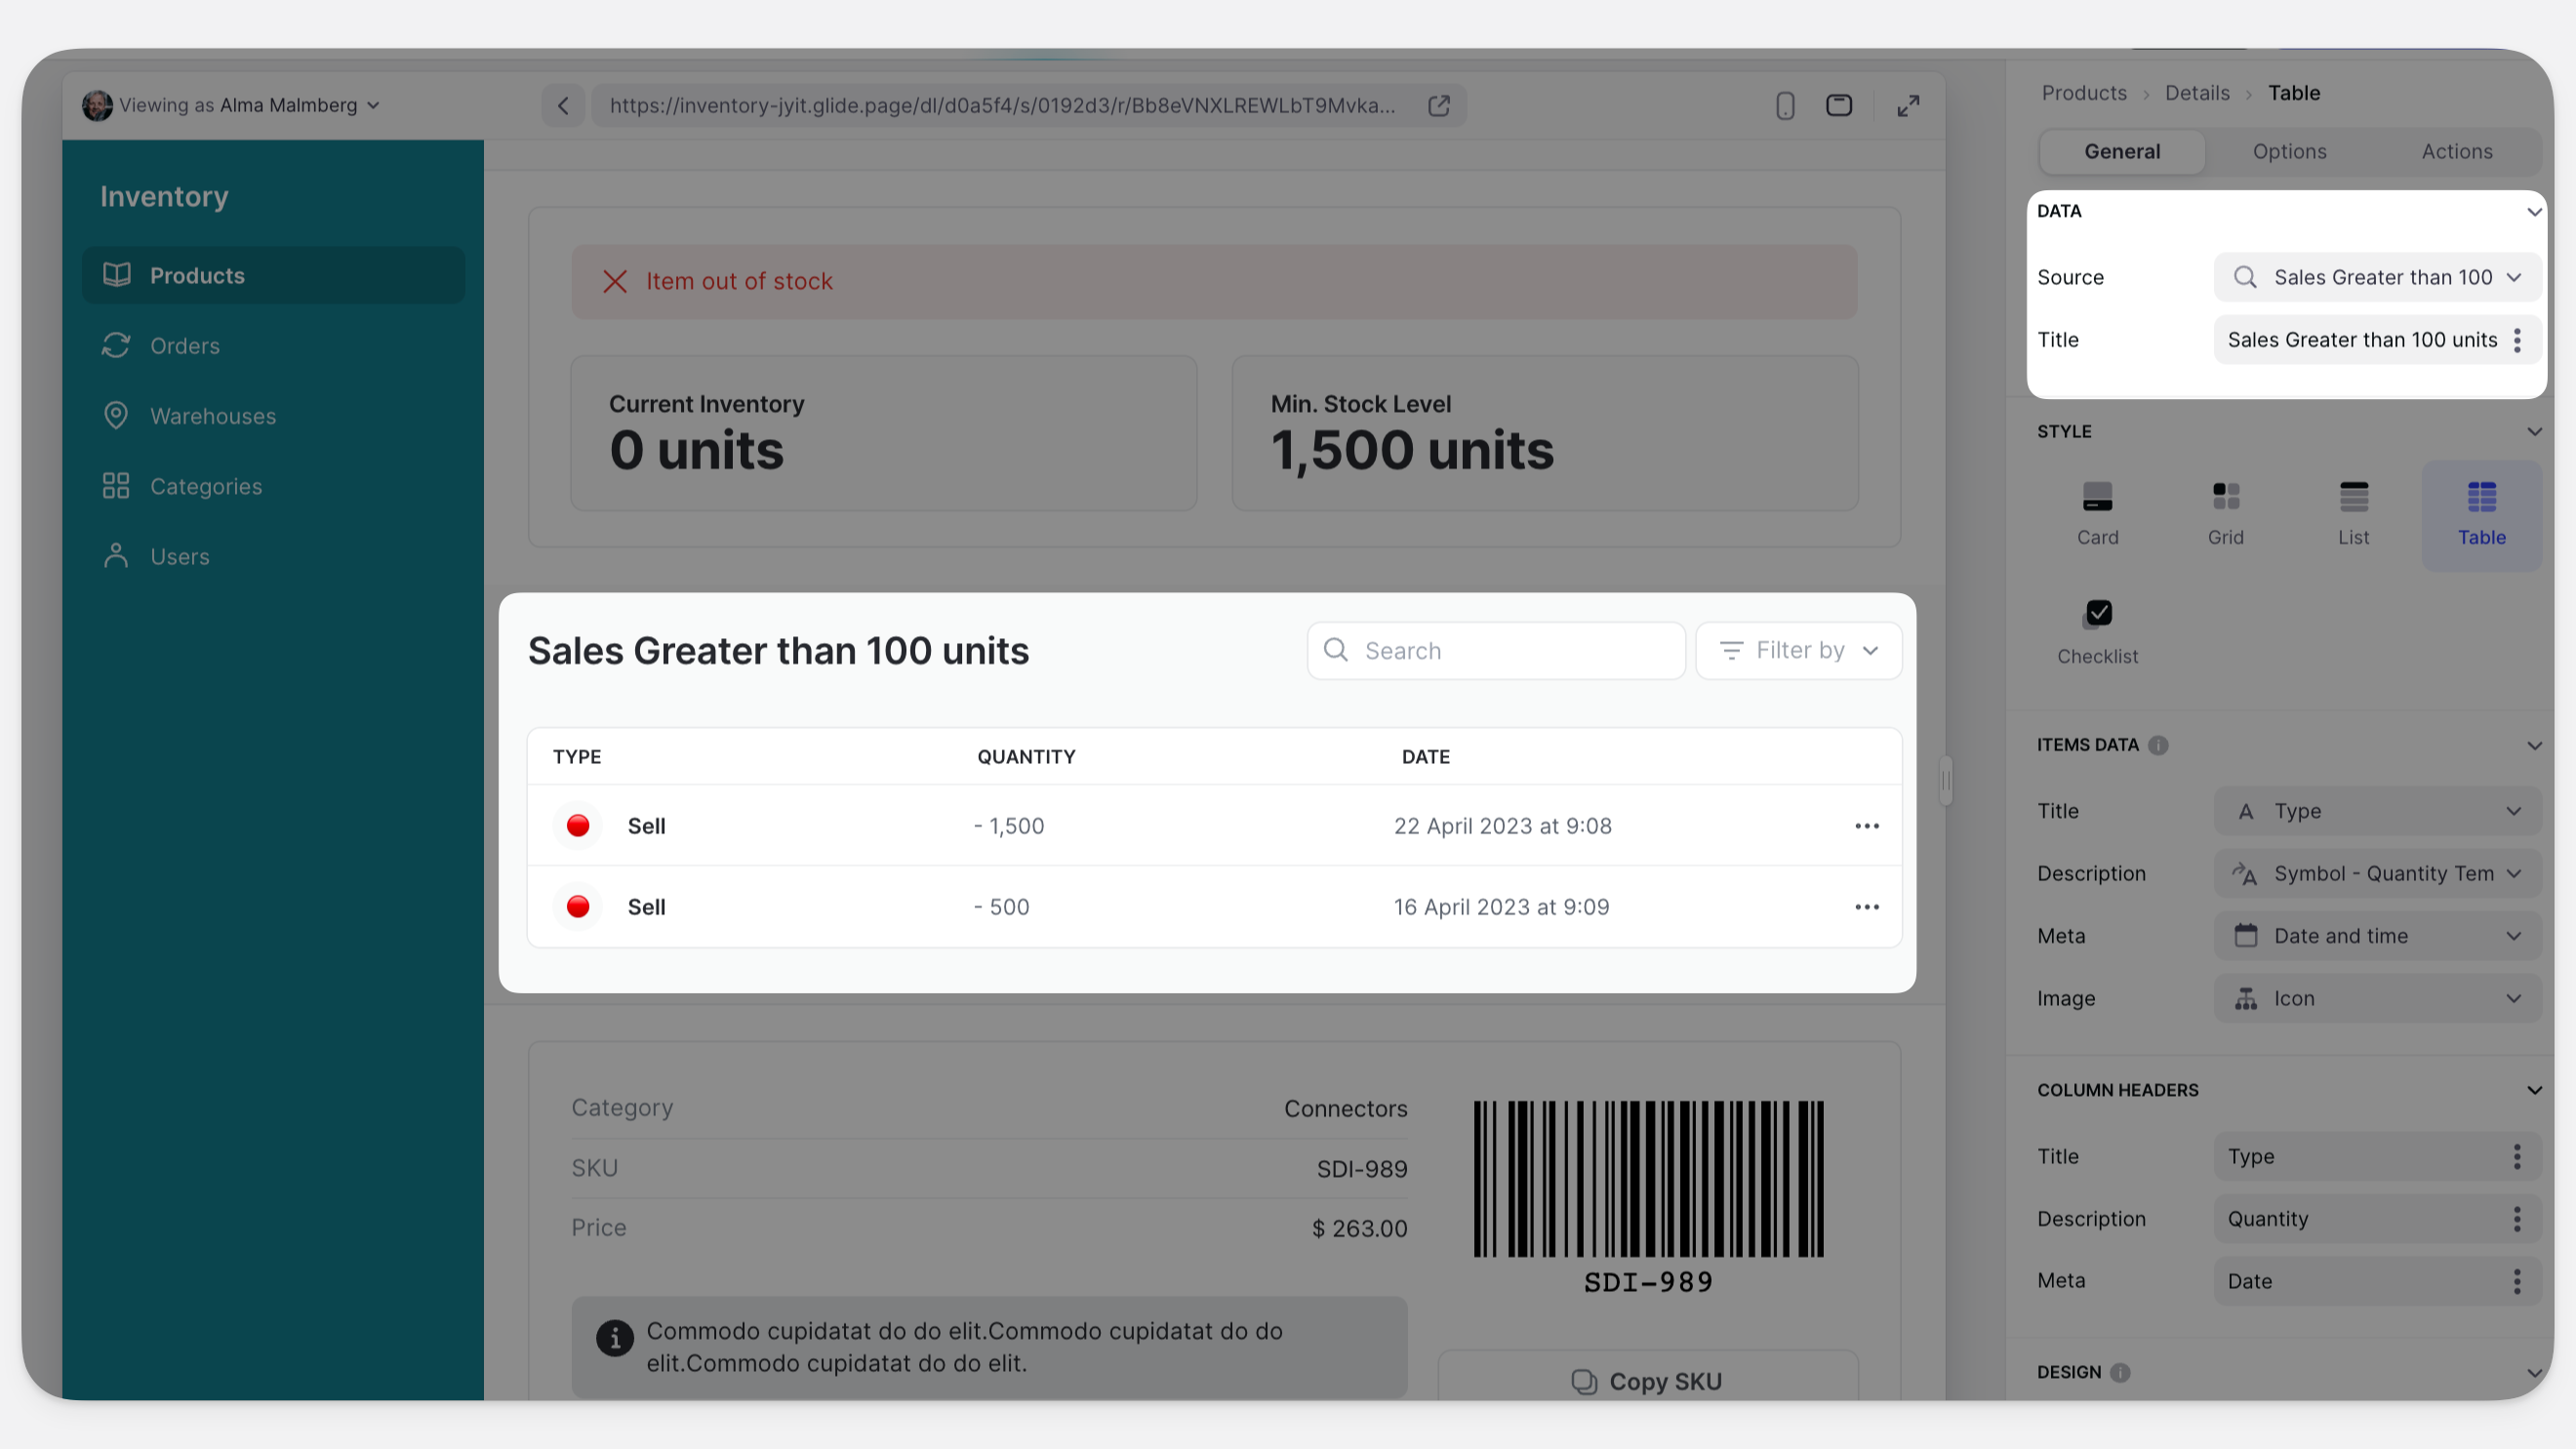
TheThis row filter allows you to match your query results to specific rows in your table. With it, you can relate the rows in a source table with the relevant rows in another table. For example, below we used a Query column to find a list of records for each Product from our Orders table. We filtered for rows where the Quantity was more than 100, and the Type was “Sell”. The This row query automatically matched the results with the relevant rows in our table, organized by SKU.
.png)
The Query column could then be used as the source of a Collection on our Product Details screen, to show all sales we made of that product that fit our filter settings:
Example 1: Sales Tracking
Imagine that you have a table containing data for 1000 sales people, including data for their salaries and sales figures:
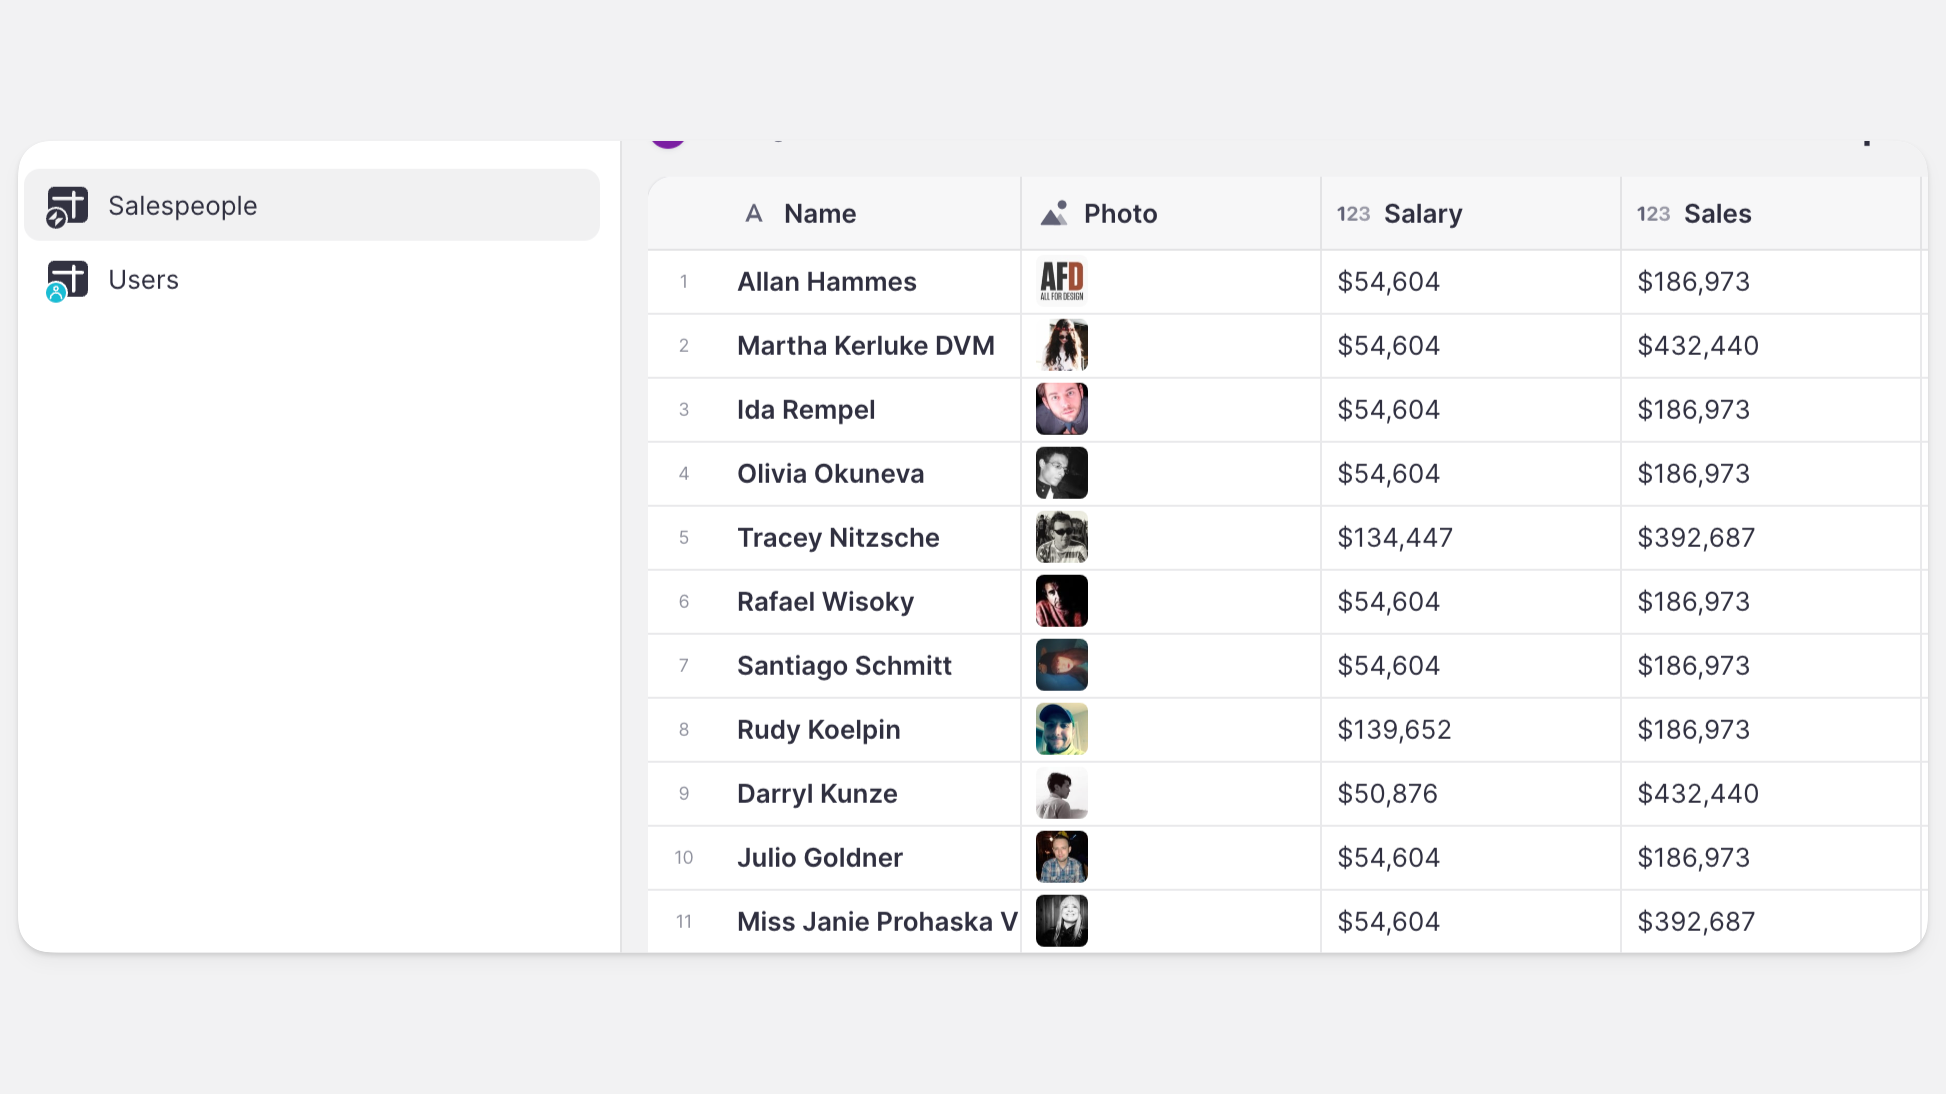
Now imagine that you would like to know what percentage of total sales is accounted for by your top 100 sales people. By leveraging the Query column, you can determine this in a few simple steps:
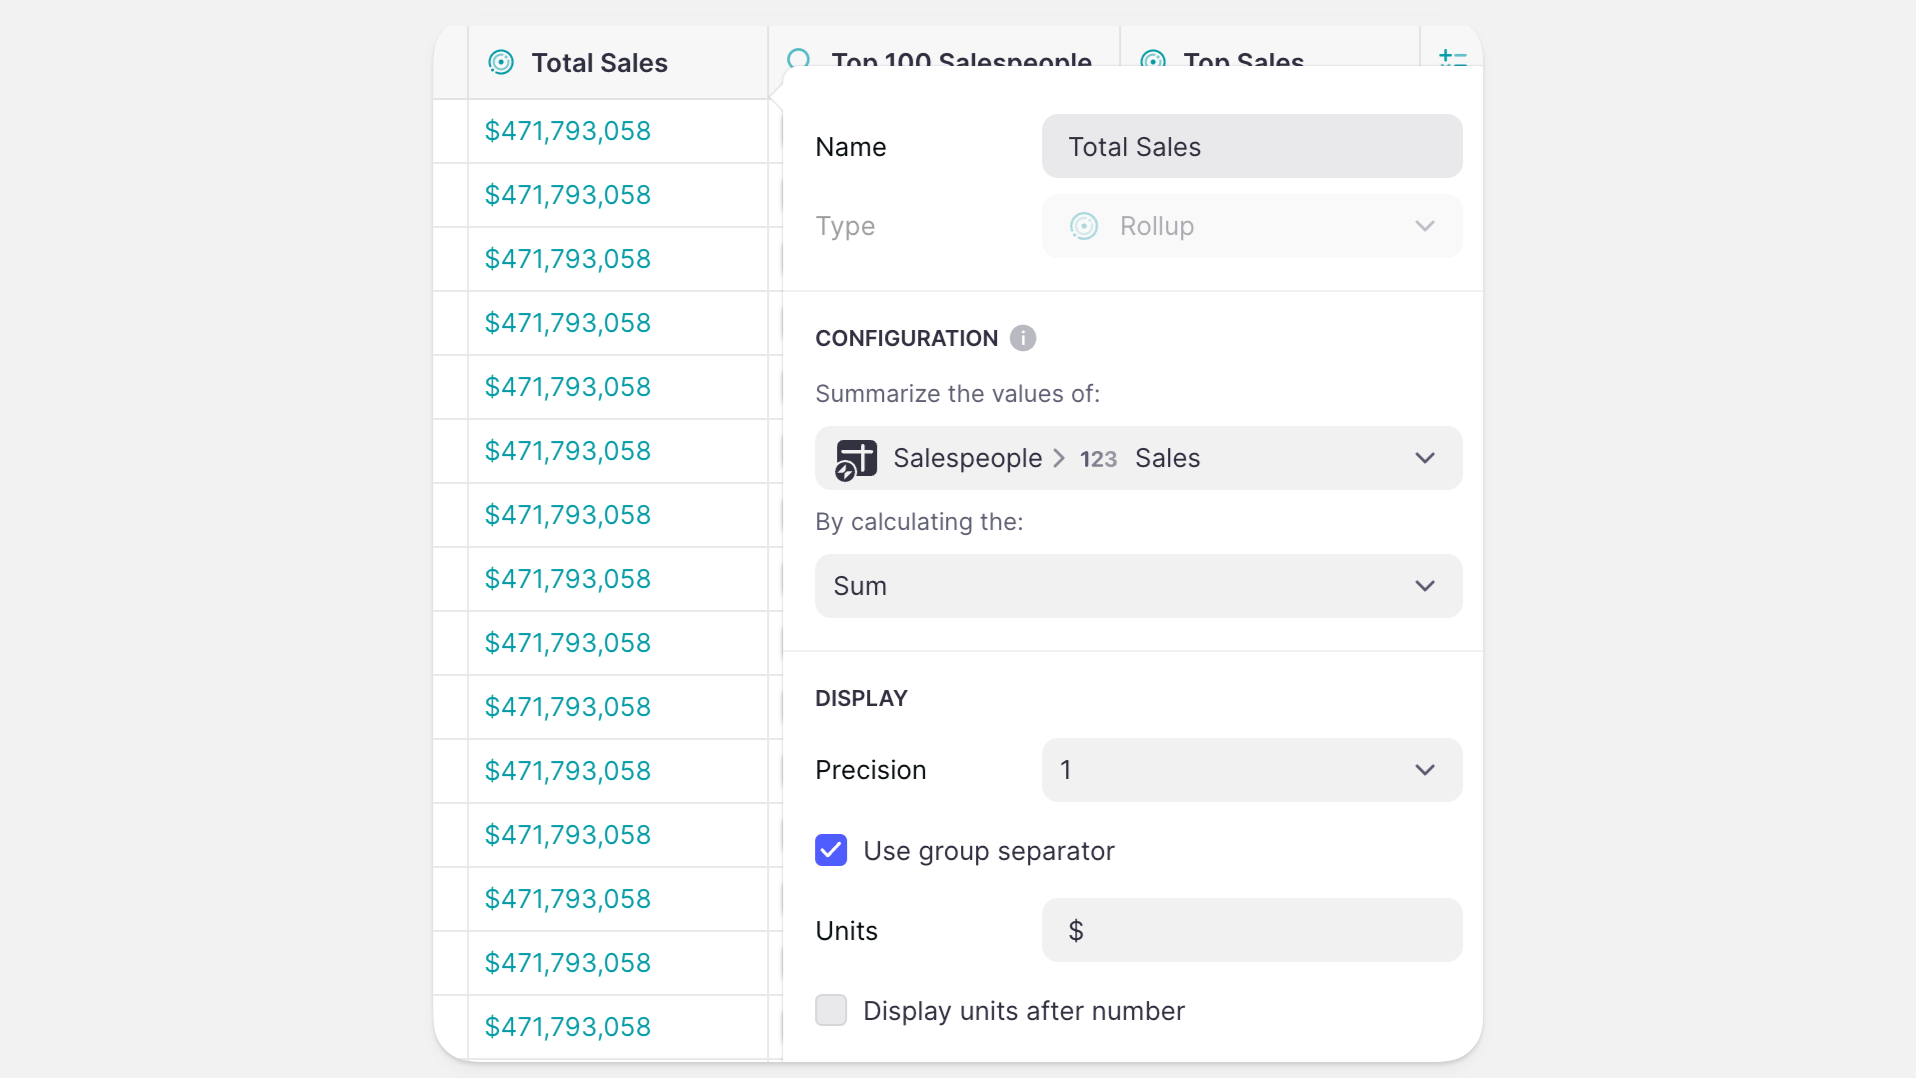
Start by calculating the total sales across all sales people. For this, use a Rollup column to calculate the sum of all Sales:
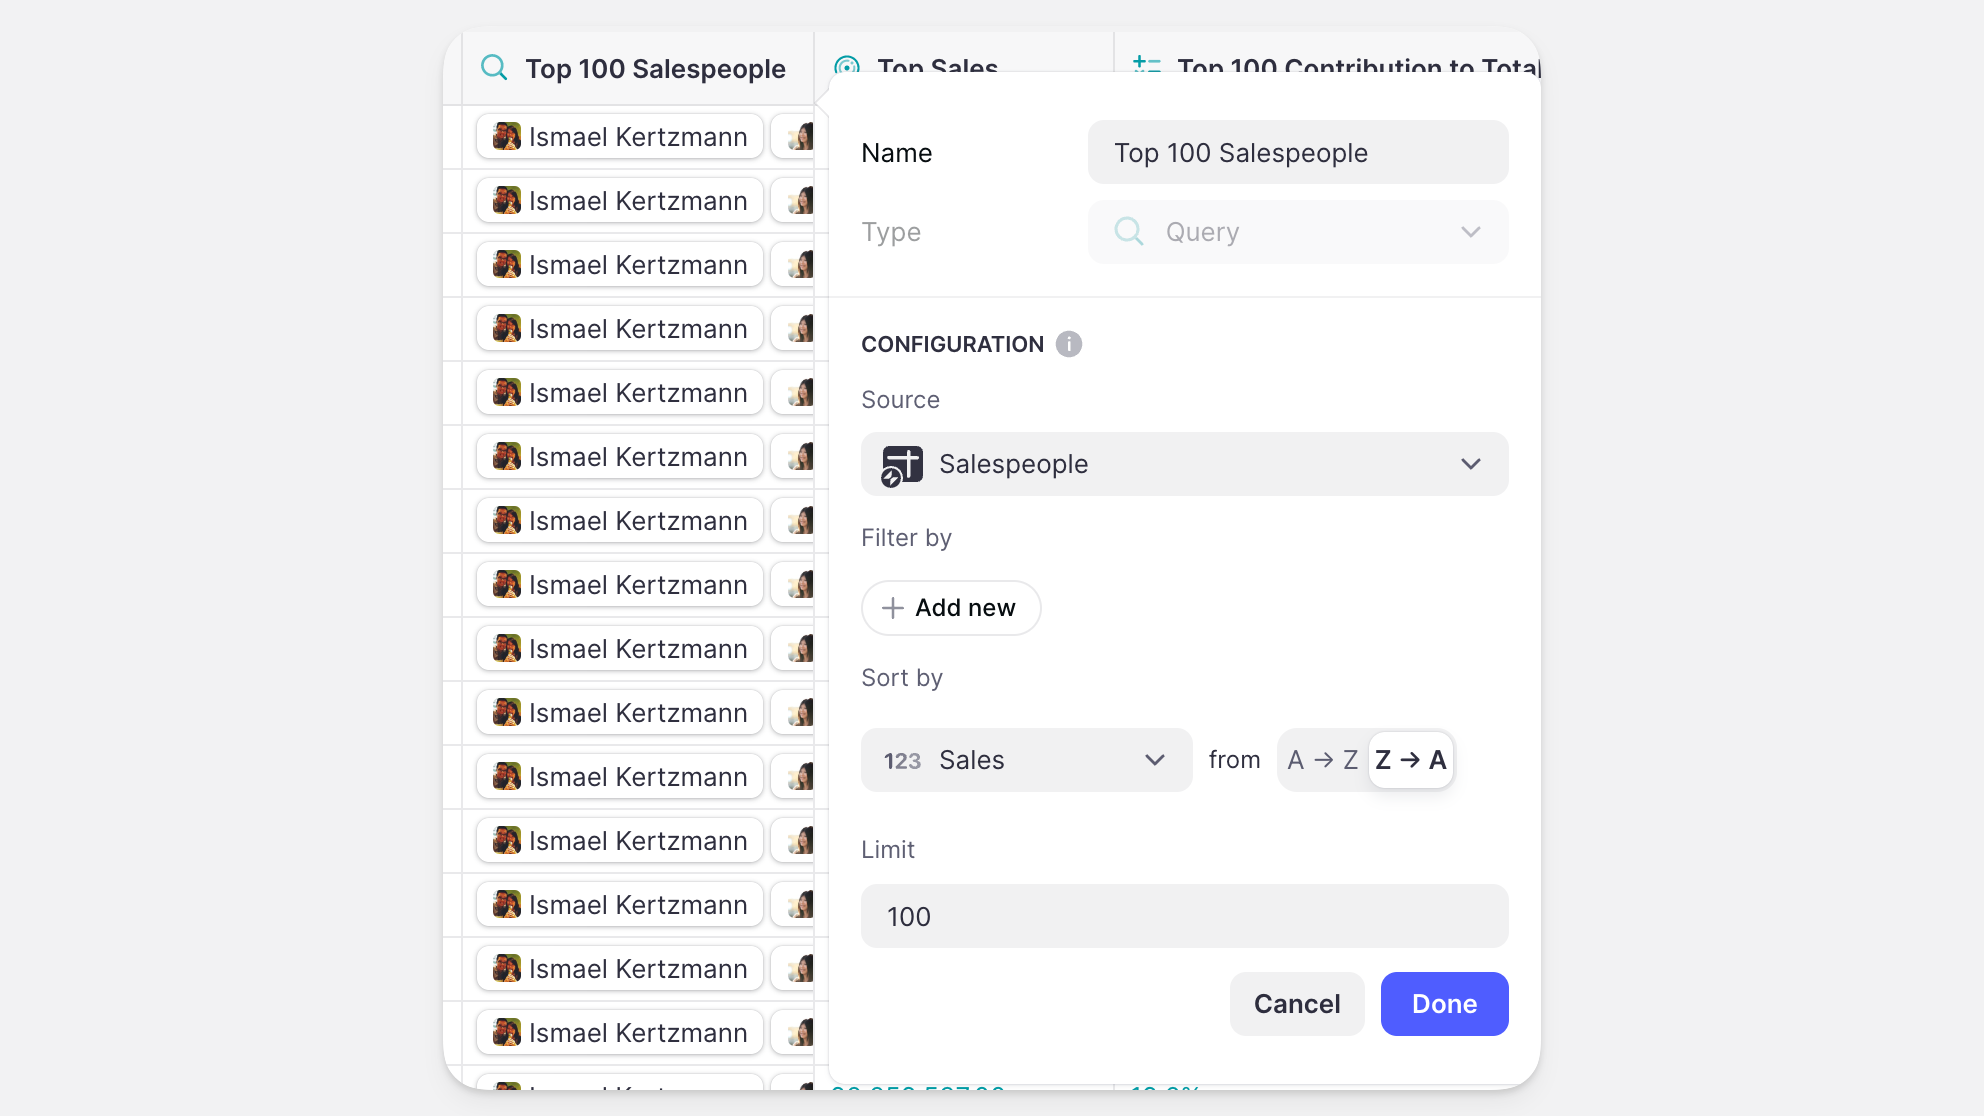
Next, use a Query column to find the top 100 sales people. This column would be configured as follows:
Source: SalespeopleSort by: Sales descendingLimit: 100
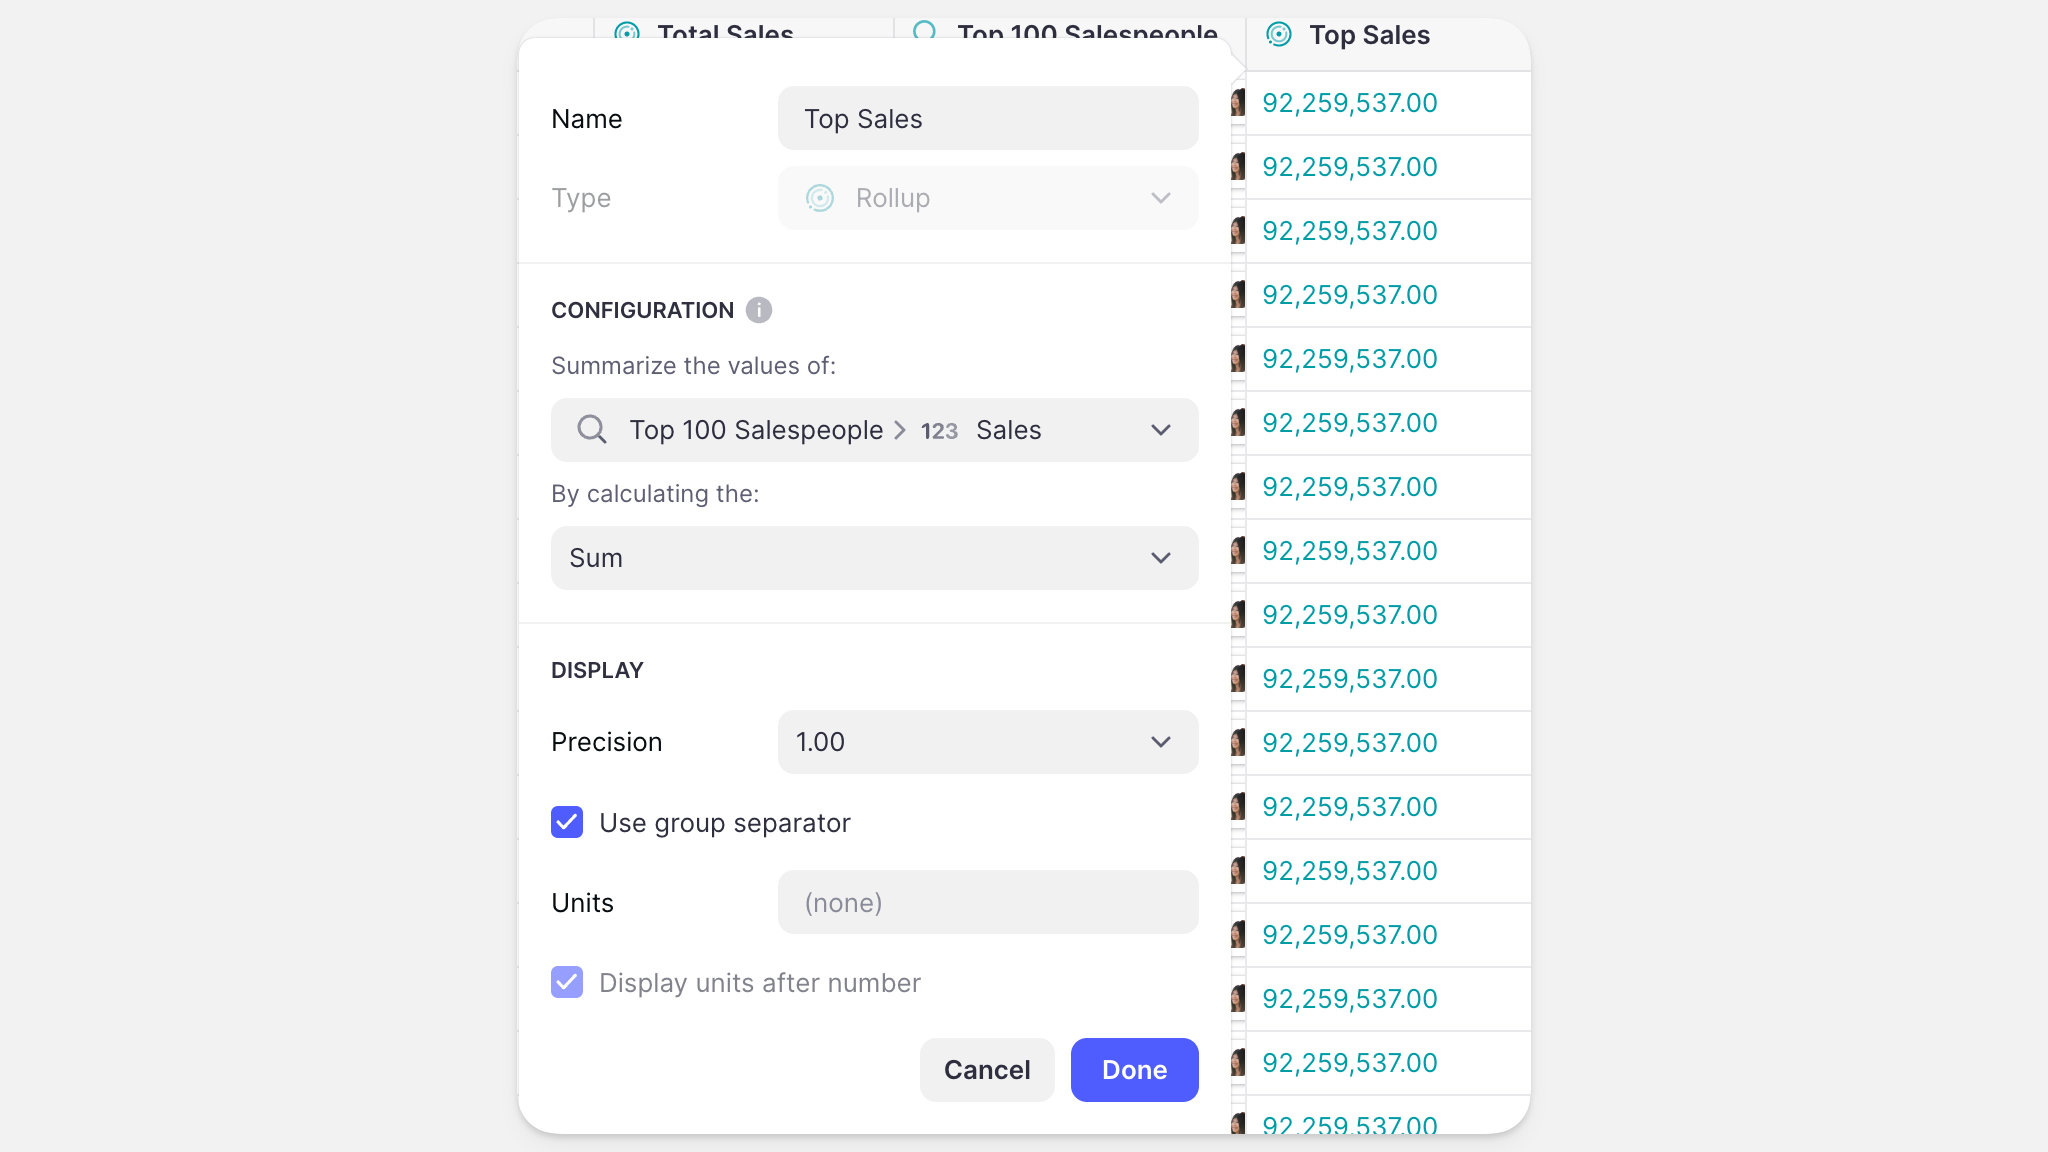
Now, calculate the total sales of the top 100 sales people. Again, a Rollup column is used taking the sum of all sales via the Query column.
Finally, use a Math column to calculate what percent of sales can be attributed to the Top 100 sales people. The formula for this is 100*Top Sales/Total Sales where Top Sales is the total sales of the top 100 sales people, and Total Sales is the total of all sales.
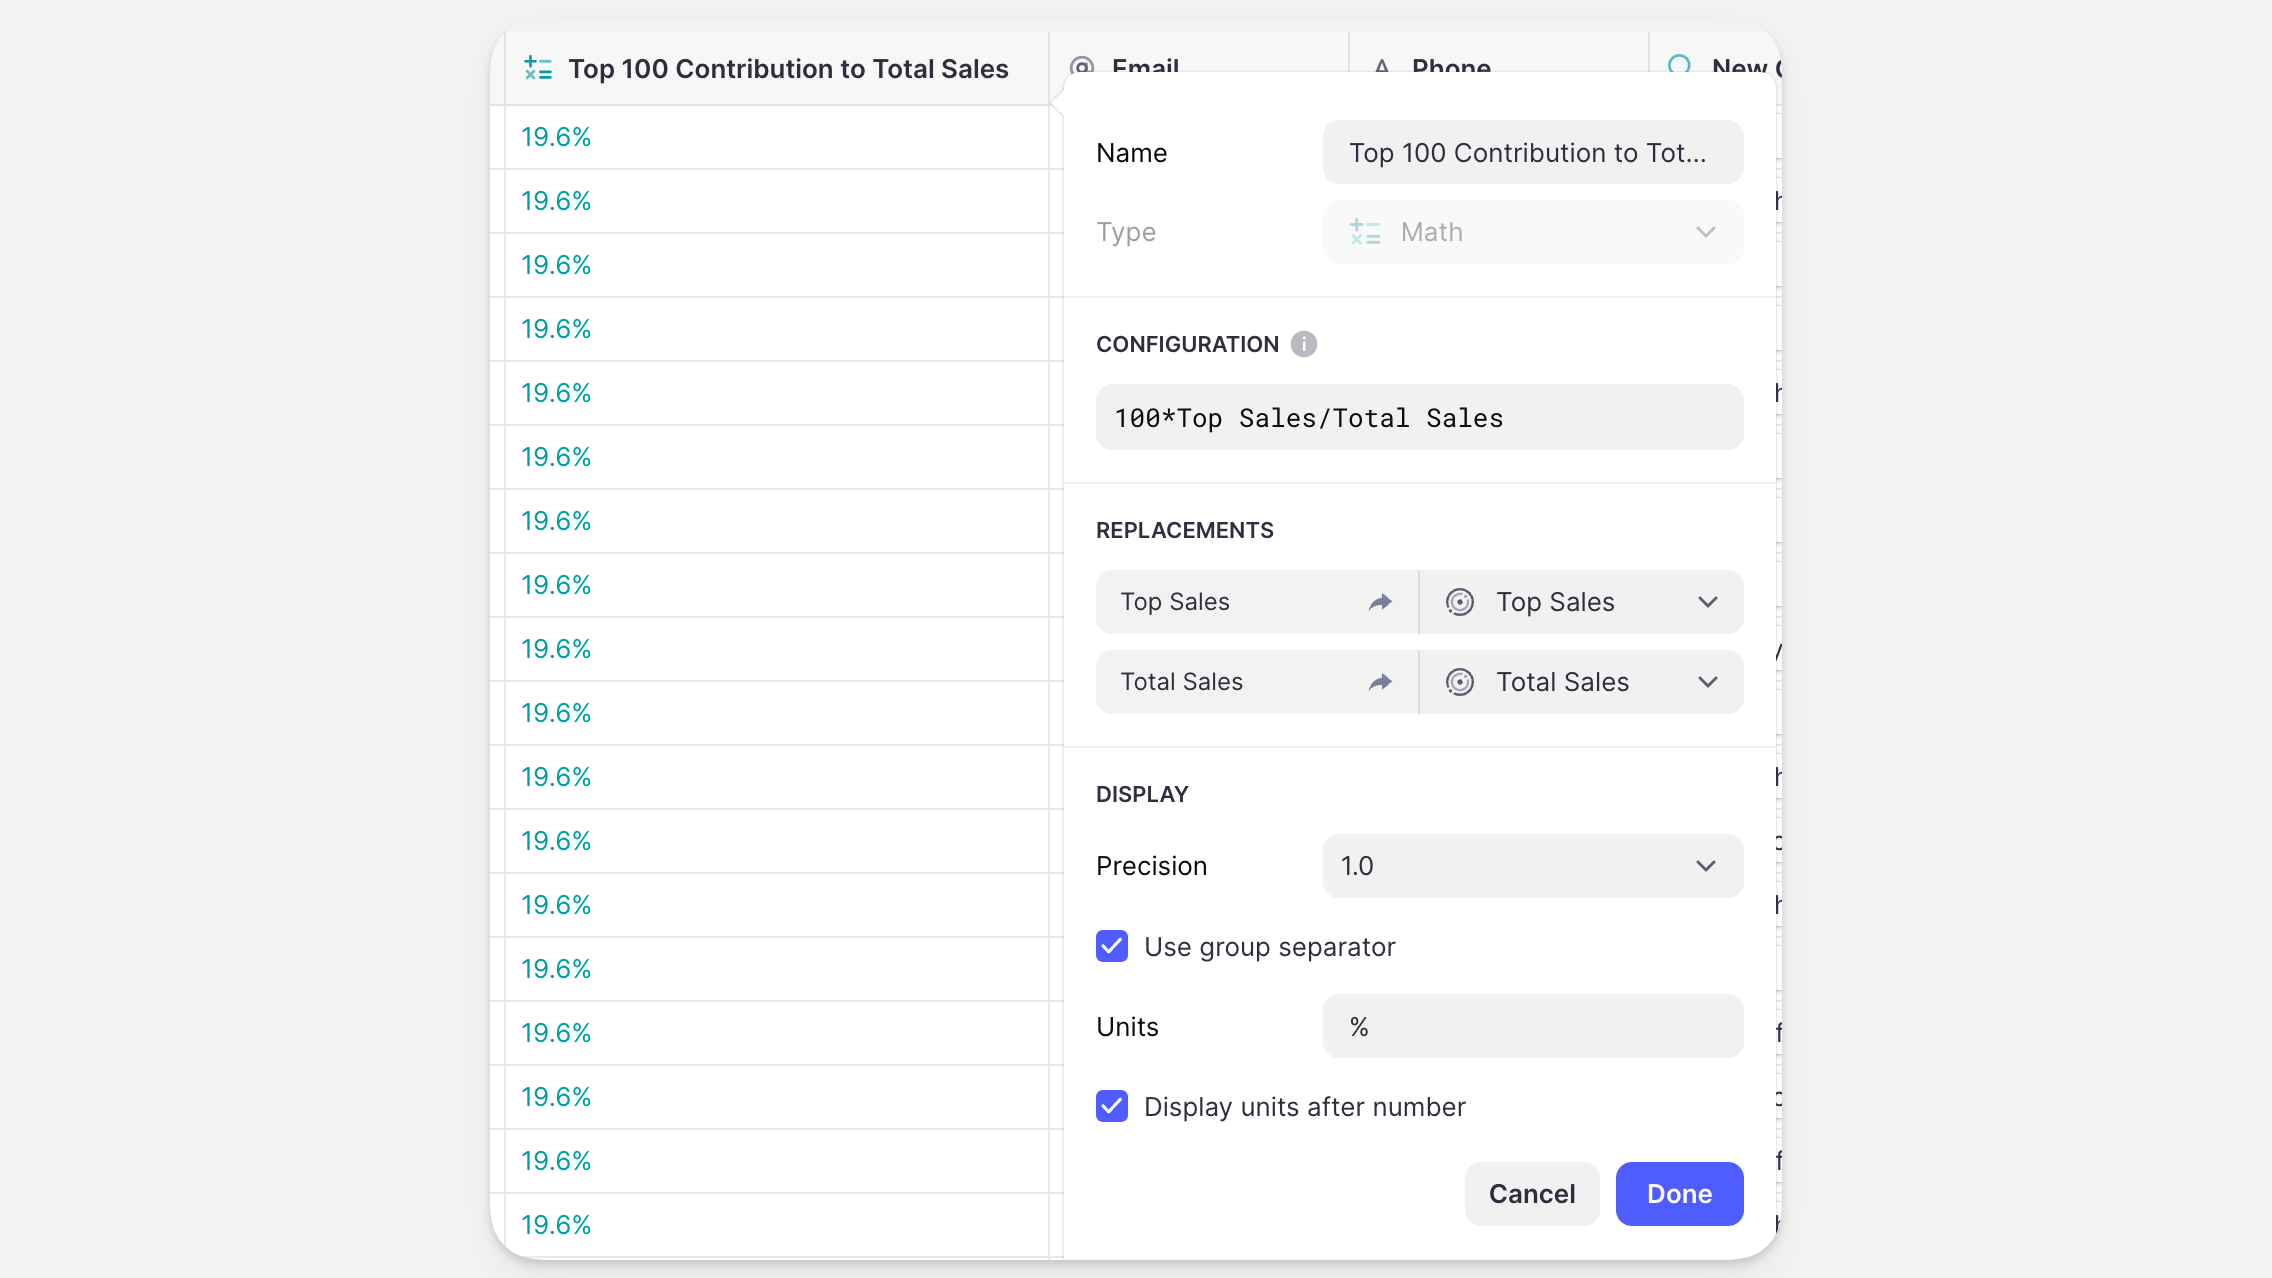
And we can see that our Top 100 Sales people have contributed 19.6% of our Total Sales.
Example 2: Gamification
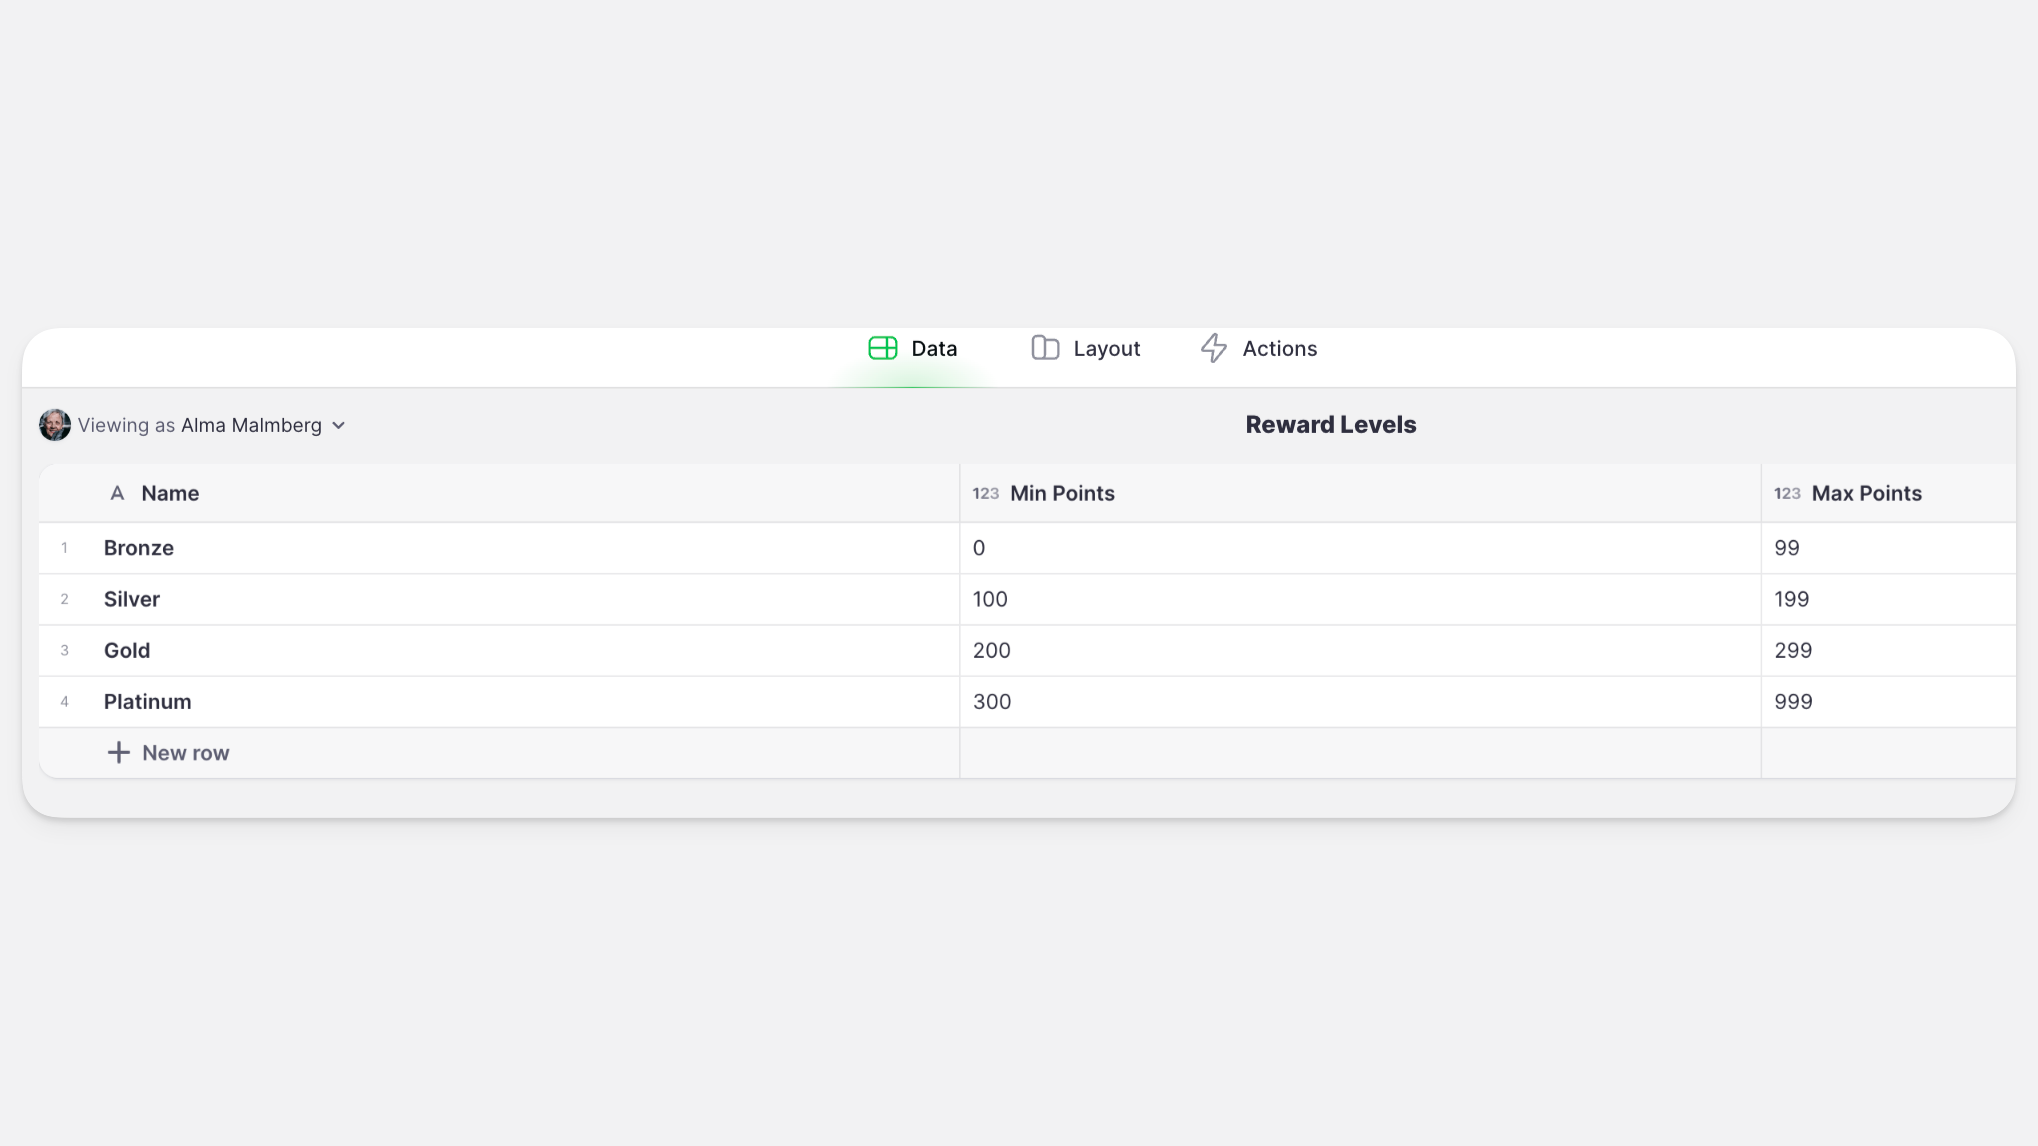
For this example, imagine that we reward our users with points, and we have defined a points table with a number of levels, and a range of points for each level:
In our Users Table, we track the points balance for each User. Now, we need to determine their “Reward Level” based on their current points balance.
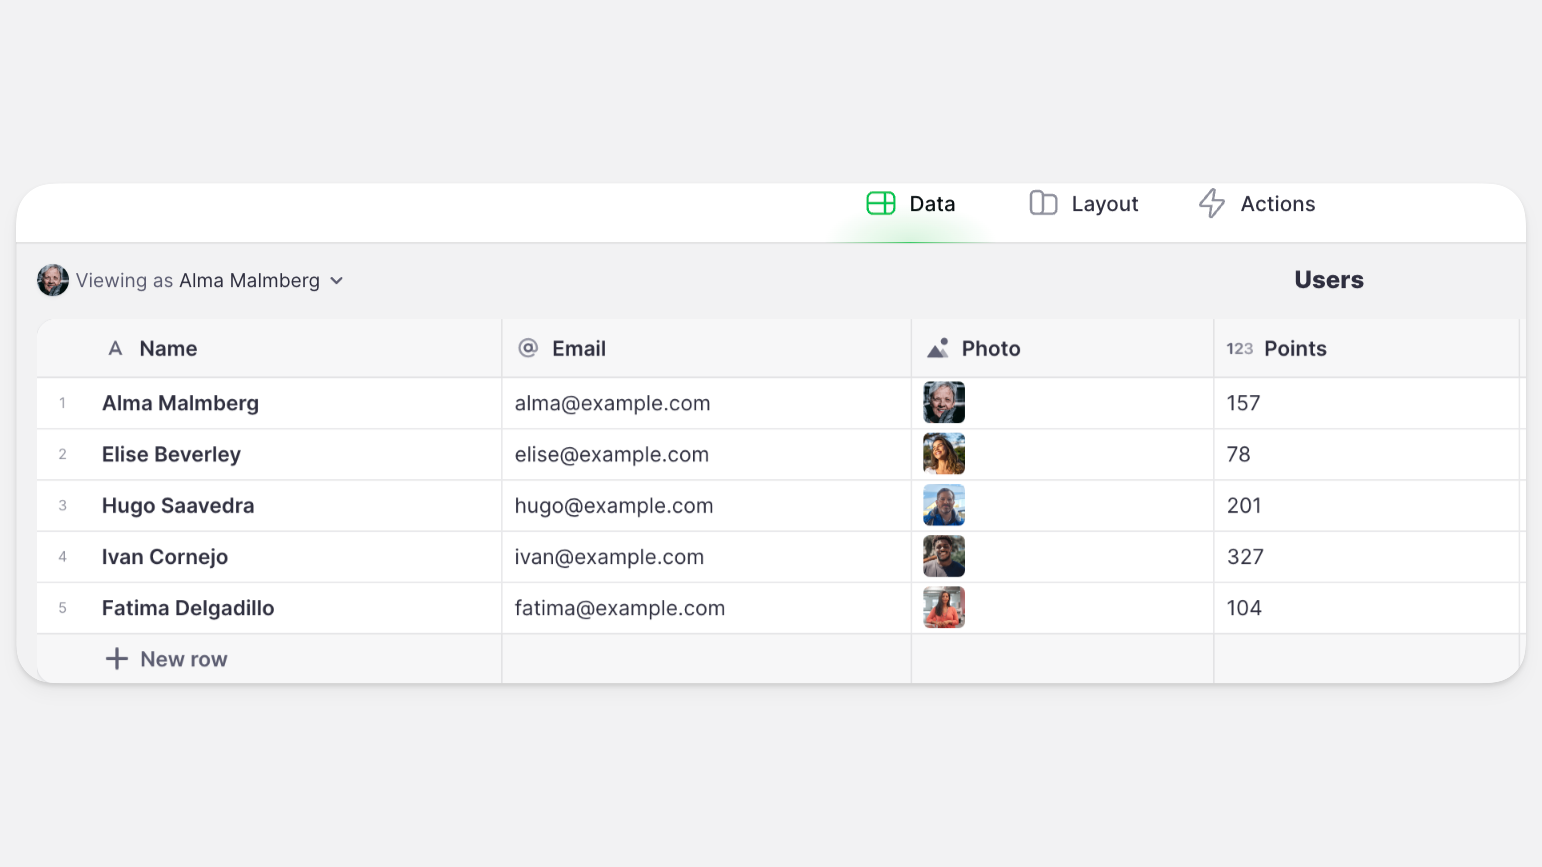
If we look at our first user - Alma - we can see that she has a current points balance of 157, which puts her at the Silver level (100-199). To include each user’s Reward Level on their User Profile page, we need to calculate their level based on points. The Query column automates the whole process.
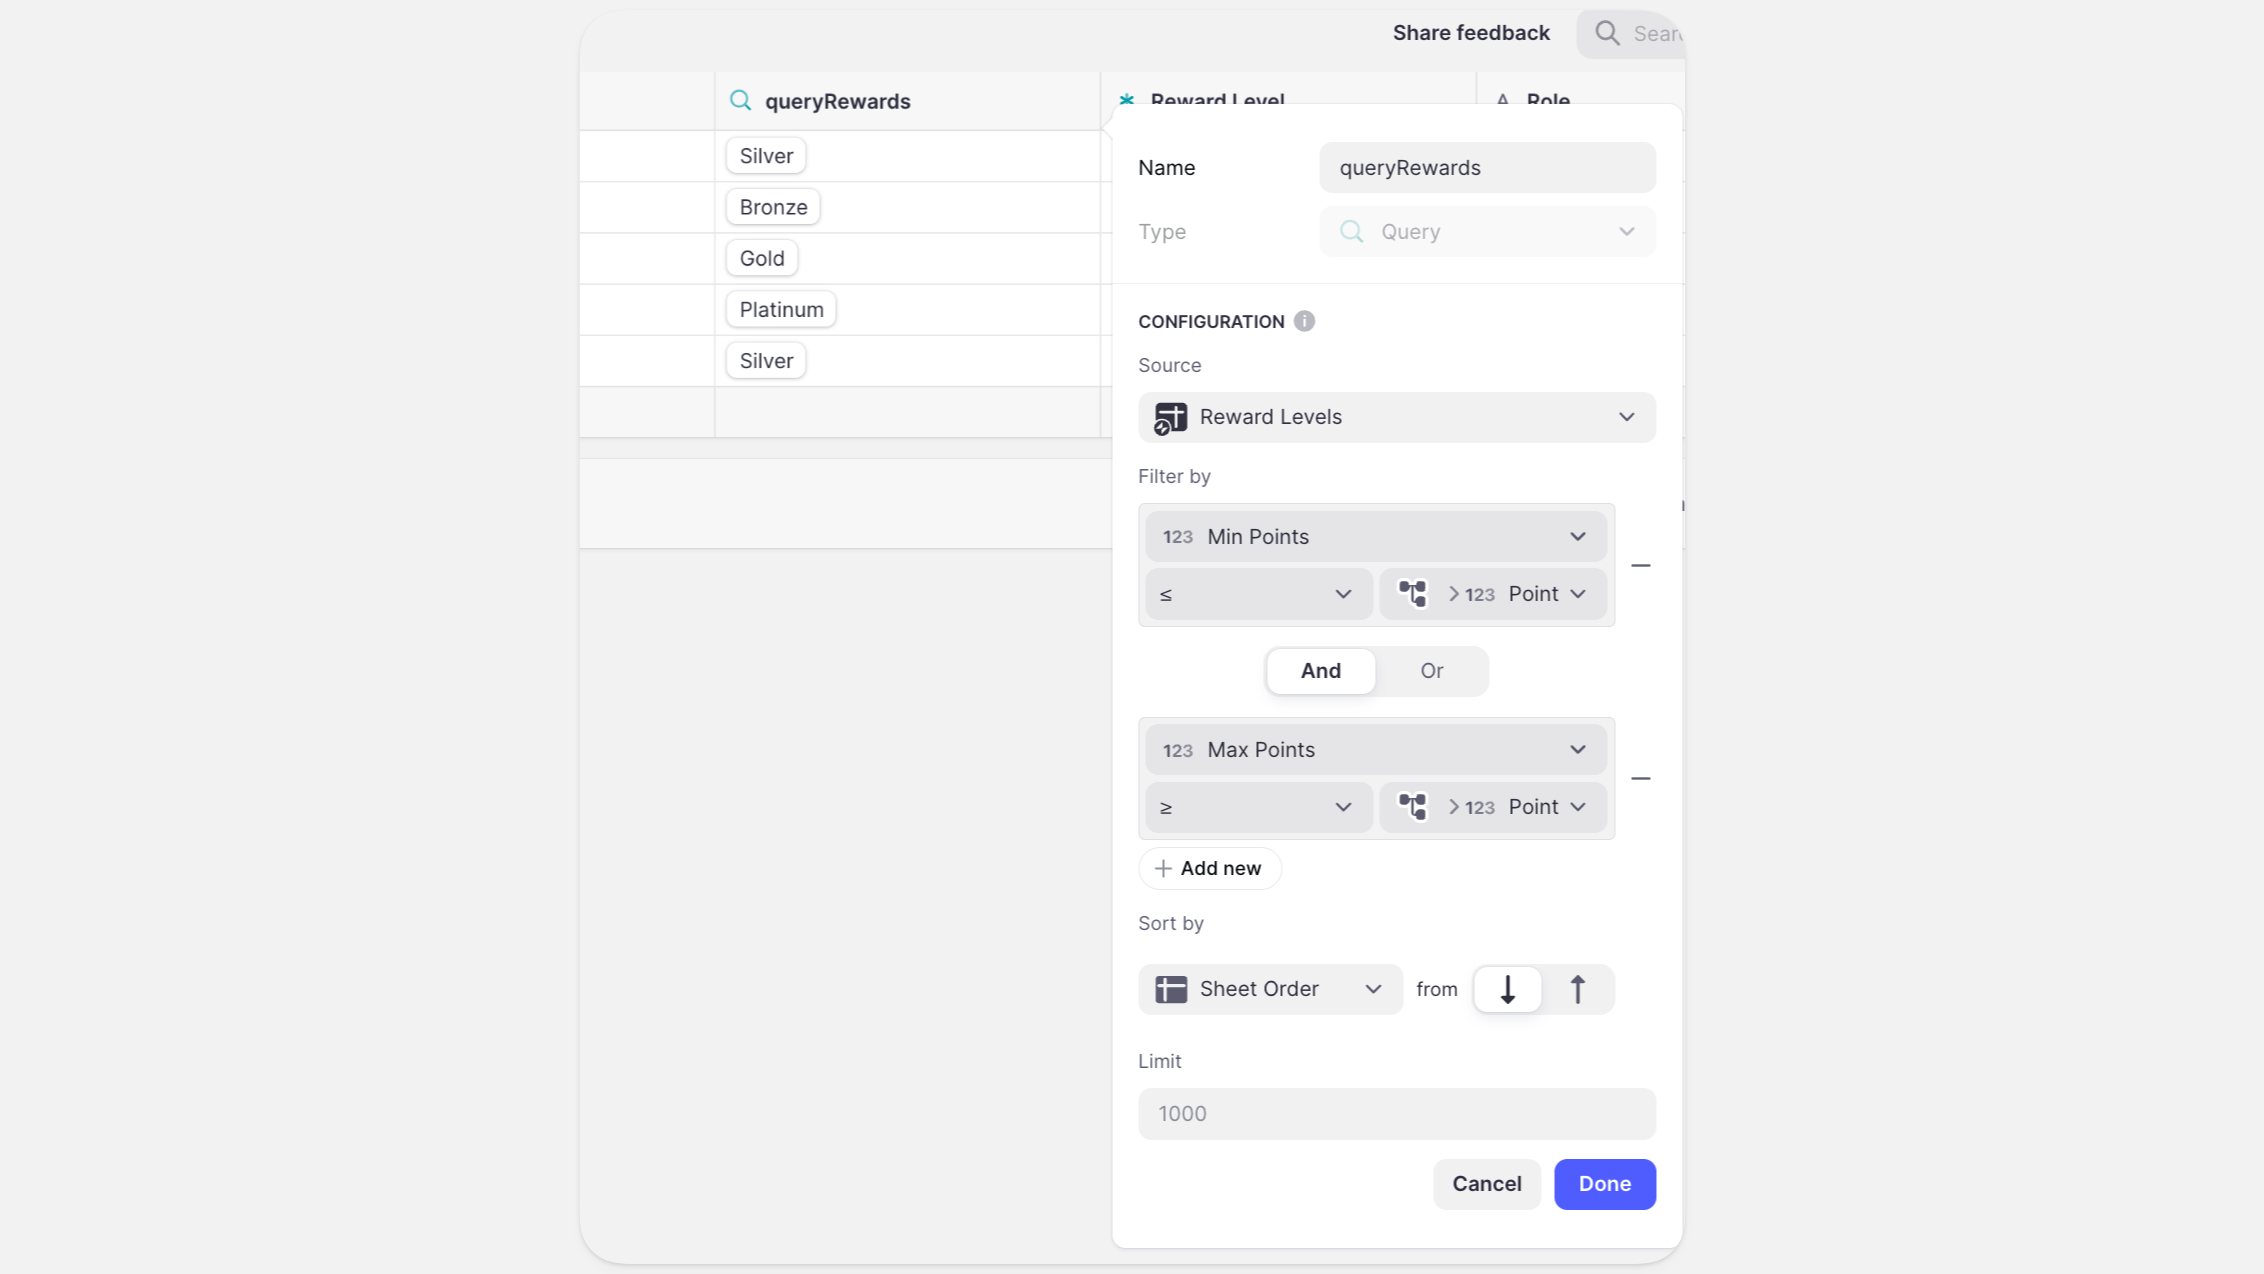
First, create a Query column in the Users table and configure as follows:
Source- Reward LevelsFilter by- Min Points is less than or equal toThis row→ Points AND Max Points is greater than or equal toThis row→ Points.- The Query in this case will only return a single match, but it will be different for each row in our Users table.
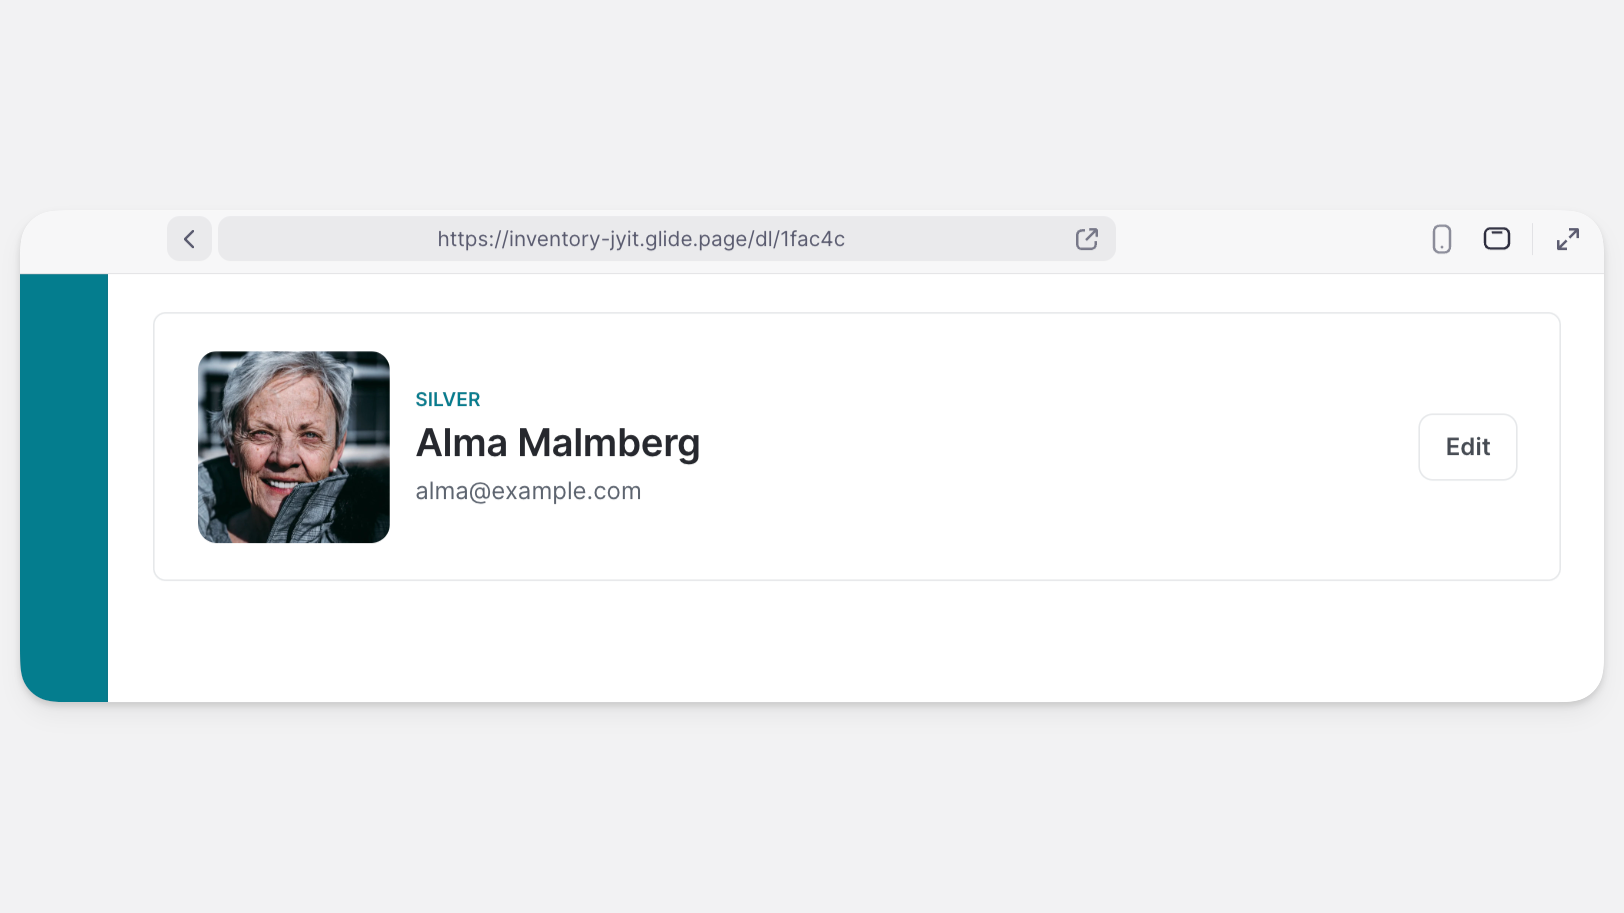
Importantly, although the Query column only returns a single match, it is the same as a Multiple Relation, so it cannot be used in any component that expects a text value. We want to use it in a Title component, so we need to retrieve the text value. To do this, we use a Single Value column:
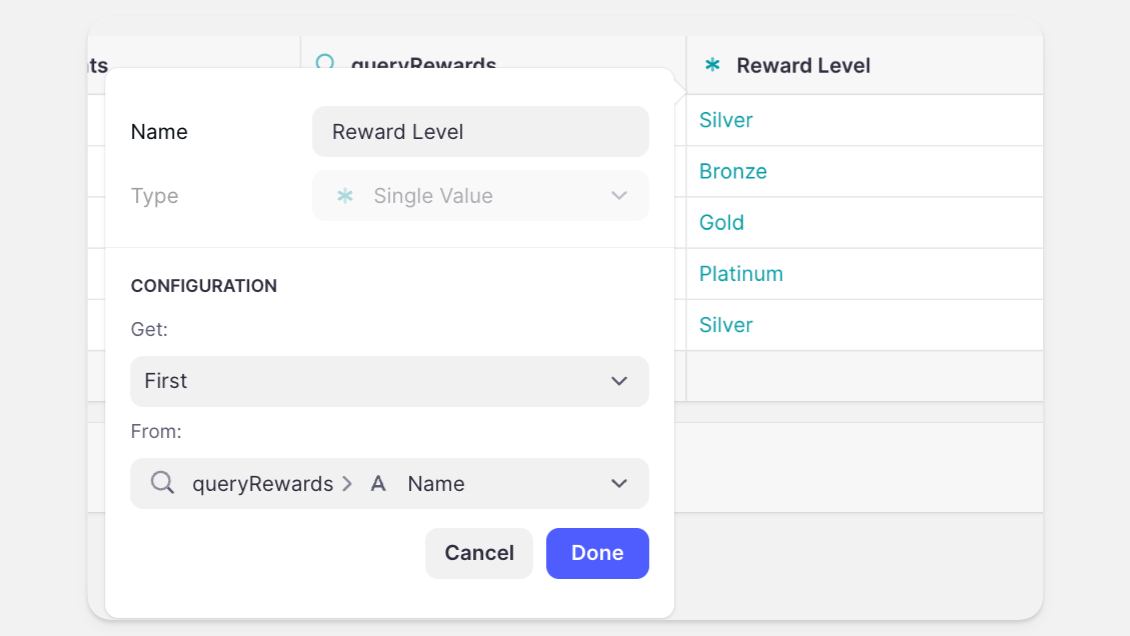
This gives us a text value that we can use in a Title component on our User Profile screen: